B2B conversion rates show how effectively your marketing and sales efforts turn prospects into customers. On average, B2B websites convert at 2.9%, but top performers achieve 8–15%, depending on the industry, channel, and sales cycle. Understanding benchmarks by industry and funnel stage is key to identifying gaps and improving performance.
Here’s a quick look at key benchmarks:
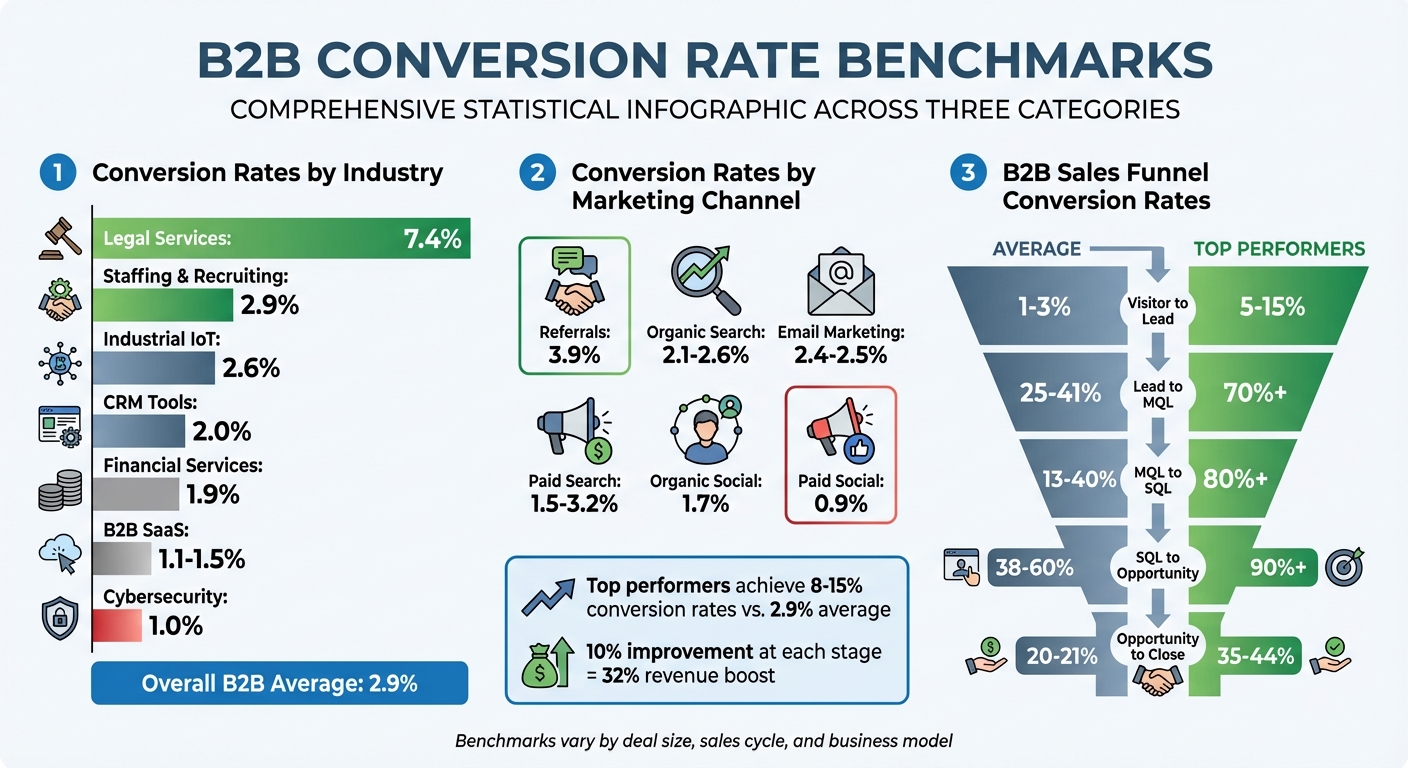
- Industry Averages: Legal services lead at 7.4%, while B2B SaaS averages 1.1–1.5%.
- Marketing Channels: Referrals convert best at 3.9%, followed by organic search at 2.1–2.6%. Paid social lags at 0.9%.
- Sales Funnel Stages: Visitor-to-lead averages 1–3%, while opportunity-to-close hovers around 20–21%.
Actionable insights include: focusing on high-intent pages like demo requests (5.5% conversion rate), responding to leads within 5 minutes, and optimizing slow-loading pages. Even small improvements at each funnel stage can lead to a 32% revenue boost.
To improve, analyze where prospects drop off, refine your messaging, and prioritize high-value actions. Whether you’re in SaaS, legal, or finance, these benchmarks and strategies can help you measure and improve your performance.
B2B Conversion Rate Benchmarks by Industry, Channel, and Funnel Stage
B2B Conversion Rate Benchmarks by Industry and Channel
Average Conversion Rates by Industry
Conversion rates can differ significantly across industries. For instance, legal services lead with a 7.4% conversion rate, largely because clients often require immediate help. On the other hand, industries like cybersecurity see much lower rates, averaging just 1.0%, while B2B SaaS companies typically fall between 1.1% and 1.5%. These differences stem from factors like longer decision-making processes and higher costs.
Staffing and recruiting firms convert at 2.9%, while CRM tools hover around 2.0%. Financial services come in at 1.9%, and industrial IoT companies see a slightly better rate of 2.6%. The general trend? Industries addressing urgent needs tend to see better conversion rates, whereas those with more complicated purchasing cycles face lower numbers.
"The average B2B conversion rate is 2.9%. That single number… gets cited everywhere – and it tells you almost nothing. Context is everything."
– Prospeo Team
Now, let’s break down how marketing channels influence these industry-specific benchmarks.
Conversion Rates by Marketing Channel
Marketing channels play a big role in shaping conversion performance. Some channels naturally deliver higher-quality traffic. For example, referrals lead the pack with a 3.9% conversion rate, thanks to the built-in trust they bring. Organic search performs well too, with rates between 2.1% and 2.6%, while email marketing lands slightly lower at 2.4% to 2.5%.
Paid search results vary, with conversion rates ranging from 1.5% to 3.2%, depending on how well the campaigns are targeted. Meanwhile, organic social converts at 1.7%, but paid social lags far behind at just 0.9%. Notably, inbound SEO leads often perform nearly twice as well as paid search leads, with conversion rates of 2.1% compared to 0.7% for visitor-to-lead conversions.
These metrics can shift further when you factor in deal size and the length of the sales cycle.
Benchmarks by Deal Size and Sales Cycle Length
Deal size and sales cycle complexity add another layer to conversion benchmarks. SMB-focused companies (with $1M–$10M in revenue) see a 2.3% visitor-to-lead rate, while mid-market companies ($10M–$100M) drop to 1.4%, and enterprise companies ($1B+) hit just 0.7%. Enterprise funnels also disqualify a significant percentage of leads – 71.2%, compared to just 21.8% for SMBs.
Sales cycles grow longer as deal values rise. Contracts under $20,000 ACV close in roughly 75 days, but deals exceeding $60,000 ACV can stretch to about 180 days. Enterprise buyers often conduct extensive research, averaging 15–30 separate website sessions before converting. Closing rates also reflect this pattern: SMBs close 46% of opportunities, mid-market companies close 39%, and enterprise companies close about 31%.
"A 0.8% conversion rate that generates 50 enterprise opportunities worth $25M in pipeline dramatically outperforms a 3% conversion rate that generates 200 mid-market opportunities worth $10M in pipeline."
– GoGreyMatter
| Deal Category | Avg. ACV | Sales Cycle Length | Expected Conversion Rate |
|---|---|---|---|
| Enterprise | $500K+ | 6+ Months | 0.5%–1.5% |
| Mid-Market | $50K–$500K | 3–6 Months | 1.5%–3.0% |
| Lower Mid-Market | $10K–$50K | 1–3 Months | 2.5%–5.0% |
sbb-itb-edfb666
How to Improve your Conversion Rate [+ Top 4 B2B SaaS Benchmarks]
B2B Sales Funnel Conversion Benchmarks
Once you’ve reviewed industry averages, the next logical step is breaking down conversion rates at every stage of the sales funnel. This analysis helps identify where potential customers drop off and highlights areas for improvement.
Conversion Rates at Each Funnel Stage
Tracking conversion rates through the funnel is key to spotting bottlenecks and refining processes.
- Visitor-to-Lead: On average, this stage sees conversion rates between 1% and 3%, with 1.5% as a typical benchmark. High-performing teams, however, can push this to 5%–15% by using optimized landing pages and ensuring fast page load times.
- Lead-to-MQL: Here, conversion rates generally range from 25% to 41%. For top-tier performers, this figure can climb above 50%.
- MQL-to-SQL: Often a challenging stage, the average conversion rate is around 40%, but it can vary widely from 13% to 40%, depending on how well sales and marketing teams collaborate. If your rate dips below 15%, it may be time to reassess lead scoring systems and how quickly sales development reps (SDRs) follow up.
"The marketing-to-sales handoff is where funnels die."
– Randy Wattilete, Founder, Kirro
- SQL-to-Opportunity: Conversion rates here typically fall between 38% and 60%, with 60% considered an average. Elite teams can achieve rates of 60%–80%, and the best often exceed 90%.
- Opportunity-to-Close: Win rates at this stage hover around 20%–21% on average. However, top performers can achieve rates of 30%–39%.
| Funnel Stage | Average Benchmark | "Good" Benchmark | "Great" (Top 10%) |
|---|---|---|---|
| Visitor to Lead | 1.0%–2.9% | 3.0% | 5.0%–15.0% |
| Lead to MQL | 25%–41% | 50% | 70%+ |
| MQL to SQL | 13%–40% | 60% | 80%+ |
| SQL to Opportunity | 38%–60% | 75% | 90%+ |
| Opportunity to Close | 15%–31% | 28% | 35%–44%+ |
These benchmarks provide a clear roadmap for improving conversions at each stage, ultimately boosting your lead-to-customer performance.
Lead-to-Customer Conversion Metrics
When you consider the entire funnel, lead-to-customer conversion rates highlight how small improvements at each stage can drive big results. For B2B SaaS companies, these rates generally fall between 0.5% and 1.5%. Broader B2B funnels, on the other hand, convert 1.5%–2.5% of leads into paying customers. Even a modest 10% improvement at every stage can lead to a 32% increase in overall revenue.
Speed matters. If you follow up with leads within 5 minutes, you’re 21 times more likely to qualify them. Waiting an hour drops your chances to a 53% conversion rate, and a 24-hour delay reduces it to just 17%.
Another critical factor? Engaging multiple stakeholders. Closed-won deals typically involve twice as many buyer contacts as deals that fall through. For transactions exceeding $50,000, a multi-threaded approach can increase win rates by 130%. Notably, the average number of stakeholders involved in B2B purchases has risen to 6.8, up from 5.4 in 2020.
Your business model also plays a role in these metrics. For example:
- Free trials without requiring credit card details convert 8%–12% of users into paying customers.
- Trials that ask for payment information upfront see higher conversion rates of 20%–25%.
- Sales-assisted models typically convert 2%–3% of visitors, while self-serve models perform better, converting 4%–6% of visitors.
How to Improve Your B2B Conversion Rates
Now that you have a clear understanding of benchmark metrics, it’s time to focus on practical strategies that can enhance your B2B conversion rates. Small, targeted changes across your funnel can add up to significant results. Here’s how you can turn insights into meaningful improvements.
Focus on High-Intent Conversions
Start by prioritizing actions that show genuine buying intent. For example, demo request pages typically convert at an average rate of 5.5%, and pricing pages come in at 3.8% – far better than general site traffic averages. These are the areas where your optimization efforts will have the most impact. Instead of chasing less meaningful actions like newsletter sign-ups, focus on driving these high-value conversions.
Reducing friction is key. Embedding a calendar directly into demo request forms or confirmation pages can dramatically increase meeting bookings. One study showed that adding a calendar boosted the form-to-booked rate from 30% to 66.7%.
Being transparent also helps. Showing pricing details on your website leads to 1.7x better pipeline quality compared to vague “contact us for pricing” forms. And while shorter forms are often recommended for B2C, the B2B space benefits from asking qualifying questions. These questions not only filter leads but also signal that your company values relevant conversations.
Even the language of your call-to-action (CTA) can make a difference. Phrases like "Book a Demo" or "Schedule a Demo" are more effective than generic terms like "Request" or "Submit". These small tweaks can shift buyer psychology and improve click-through rates.
Use Data to Find and Fix Bottlenecks
Optimizing individual conversion pages is important, but a broader look at your funnel often reveals the biggest opportunities. Break down your funnel into stages and analyze where drop-offs occur – whether it’s at the MQL-to-SQL stage or during the opportunity-to-close phase. By focusing on these specific pain points, you can make targeted improvements.
Speed matters. Responding to leads within an hour results in a 53% conversion rate, compared to just 17% if you wait 24 hours. Similarly, faster website load times can make a big difference. Pages that load in 1 second convert 3x better than those taking 5 seconds. Addressing these issues can lead to quick wins.
Don’t overlook data hygiene. For instance, in 2026, cybersecurity firm Snyk discovered that email bounce rates of 35-40% were derailing their outbound efforts. By refreshing their data every seven days and verifying contact details, they reduced bounces to under 5%, leading to an 180% increase in AE-sourced pipeline and over 200 new opportunities per month.
Other companies have seen success by refining their processes. Filtrous, a laboratory supplier, switched to Shopify to implement customer-specific catalogs and automated workflows, boosting their organic B2B conversion rate by 27% and saving their support team 10 hours per week. Similarly, Future Glass replaced manual quoting with a self-serve CPQ system, resulting in a 340% growth in B2B sales and an 83% increase in conversion rate.
How Skilled Talent Supports Conversion Goals
Even the best strategy needs skilled professionals to bring it to life. Assigning clear ownership of each funnel stage ensures accountability and faster progress. For example, marketing teams can focus on Visitor-to-MQL conversions, while sales teams handle SQL-to-Won stages. This structure makes it easier to track performance and implement changes.
Skilled team members also bring valuable insights. Sales development reps (SDRs) and customer success managers (CSMs) provide qualitative feedback that complements your analytics, helping to uncover friction points that data alone might miss. Conversion rate specialists apply principles like Hick’s Law (reducing choices to simplify decisions) and Fitts’s Law (optimizing CTA size and placement) to improve buyer interactions.
The quality of your sales execution is just as critical. Top-performing sales reps focus on understanding pain points, delivering value, and avoiding feature overload during discovery calls. If your win rates are under 15%, it’s time to audit your demos and ensure follow-ups happen promptly.
For companies that lack in-house expertise, nearshore staffing solutions like Kreativa Inc offer a cost-effective alternative. Kreativa connects U.S. businesses with skilled marketing strategists, sales professionals, and customer support teams based in Latin America – at nearly 50% lower cost than hiring domestically. With time zone alignment and English fluency, these professionals integrate seamlessly into existing teams. Whether you need help optimizing landing pages or speeding up lead responses, Kreativa handles recruitment, onboarding, and compliance so you can focus on driving results.
"B2B teams win when conversion rate maths is visible, shared, and tied to action."
– Camille Wattel, Customer Success Manager, Zeliq
Conclusion
B2B conversion benchmarks provide a clear lens to evaluate your performance against industry standards. Context matters here. For instance, a 0.8% conversion rate on a $500,000 product can yield significant profits, while a 5% rate on a $500 product might fall short. The trick is to analyze your metrics within the framework of your industry, deal size, and traffic sources to get an accurate assessment.
Small improvements can lead to big wins. A 10% boost at each stage of your funnel could translate to a 32% increase in total revenue. Whether it’s cutting page load times, responding to leads faster, or cleaning up your data, each tweak adds up to meaningful progress.
When it comes to conversions, quality beats quantity every time. High-intent pages – like those for pricing or demo requests – achieve conversion rates between 3.8% and 5.5%, outperforming general website traffic. And while 61% of B2B buyers lean toward a rep-free experience, those who opt for fully self-service purchases are 1.65 times more likely to regret their decision. This highlights the value of skilled sales and marketing teams in guiding buyers through complex choices.
These insights pave the way for actionable strategies to refine your funnel performance.
Next Steps for Your Business
Start by tracking your performance across all funnel stages over the next 90 days. Use the benchmarks from this guide as a reference point, but don’t overlook your historical data – it’s the trend, not just the current position, that tells the real story. Pinpoint the stage in your funnel with the steepest drop-off and focus your efforts there first.
Address technical challenges immediately. For example, pages that load in 1 second convert three times better than those that take 5 seconds. Establish a consistent A/B testing routine to refine headlines, CTAs, and landing page designs, ensuring ongoing improvements.
How Kreativa Inc Can Help
If implementing these strategies feels overwhelming, expert help can make all the difference. Optimizing conversion rates is a specialized task that often requires skills not readily available in-house. Professionals with the right expertise can identify whether your challenges stem from traffic quality, messaging, or technical issues – and tailor solutions to fit your industry.
Kreativa Inc offers a cost-effective way to access top-tier talent. By connecting U.S. businesses with highly skilled marketing strategists, sales reps, and customer support professionals based in Latin America, Kreativa delivers up to 50% savings compared to domestic hiring. With professionals working in U.S. time zones, you avoid the headaches of late-night calls or delays. Their English fluency and understanding of U.S. business practices make them a seamless addition to your team.
Whether you need help fine-tuning landing pages, speeding up lead responses, or improving data hygiene, Kreativa handles recruitment, onboarding, payroll, and compliance. This allows you to stay focused on driving results. For companies aiming to reduce costs while gaining reliable, high-quality support to boost conversions, Kreativa’s nearshore staffing solutions are an ideal choice.
FAQs
What’s the best B2B conversion rate benchmark for my company?
When it comes to B2B conversion rates, the "ideal" number depends heavily on factors like your industry, target audience, and where prospects are in your sales funnel. On average, B2B websites see conversion rates between 2% and 3%, but this can vary significantly by industry.
For instance, legal services tend to perform much better, with an average conversion rate of 7.4%, while B2B SaaS companies typically hover around 1.1%. These differences highlight the importance of focusing on benchmarks that align with both your industry and the specific stage of your funnel. Doing so helps you set realistic goals and pinpoint areas that need improvement.
Which funnel stage should I fix first to boost revenue fastest?
To increase revenue fast, zero in on the weakest link in your sales funnel. Pinpoint the stage with the lowest conversion rate, as fixing it can deliver quick wins. For many B2B companies, the MQL-to-SQL handoff tends to be a trouble spot, with conversion rates typically hovering around 15-21%. Take a close look at your funnel, spot the stage where you’re losing the most leads, and focus your efforts there for rapid improvements.
How many conversions do I need to judge results reliably?
To get dependable results, aim for a minimum of 100 conversions per funnel stage. Hitting this number helps cut through statistical noise, giving you a clearer picture of how things are performing. Some industry guidelines suggest anywhere from 100 to 200 conversions per stage, depending on your specific funnel and objectives. For instance, achieving 100+ visitor-to-lead conversions can help you assess whether your rates fall within the usual range of 1.5%–3% for that stage.