
User journey analytics helps you understand how customers interact with your brand across every touchpoint – emails, websites, apps, and more. Unlike standard analytics, which focus on isolated metrics, this approach connects the dots to show the entire customer journey. The payoff? Companies using advanced journey analytics see 5-8x higher ROI and 58% better customer retention. Here’s how it works:
- Tracks entire customer journeys: From first visit to purchase and beyond.
- Identifies friction points: Pinpoints where users drop off or encounter issues.
- Personalizes experiences: Uses behavioral data to tailor interactions in real time.
- Improves decision-making: Replaces guesswork with actionable insights.
User Journey Analytics Fundamentals
What Is User Journey Analytics?
User journey analytics is all about tracking how customers interact with a brand across multiple channels. It pieces together data from emails, website visits, mobile apps, social media ads, and even customer support calls into a single, cohesive timeline. The ultimate goal? To understand what drives customer behavior.
Unlike traditional analytics, which zero in on specific metrics like pageviews or bounce rates, user journey analytics focuses on the sequence of events. For example, an abandoned cart email might prompt a customer to revisit the website, eventually leading to a purchase.
"Customer journey analytics (CJA) is the process of analyzing the entire customer journey through customer data points, then strategizing ways to improve the overall customer experience (CX)."
- Audrey Xu Leung, Former Global Solution Architect, Amplitude
The impact of this approach is clear. A whopping 73% of businesses using Google Analytics 4 prioritize funnel analysis as their primary journey analysis tool. On top of that, 80% of consumers say they’re more likely to buy from brands that use journey data to personalize their experience.
Now, let’s break down the key components that make up a user journey.
Core Elements of a User Journey
To fully understand user journey analytics, it’s essential to dive into its three main components: stages, touchpoints, and data signals.
- Stages: These are the phases of the customer lifecycle – awareness, consideration, purchase, and post-purchase retention. Each stage serves a unique purpose. For instance, during the awareness phase, users discover your brand, while the consideration phase is all about comparing options. Post-purchase, the focus shifts to loyalty and retention.
- Touchpoints: These are the moments when customers interact with your brand, whether through search results, social media ads, website visits, mobile apps, or customer support. Each touchpoint provides data that helps map how users move through the different stages.
- Data signals: These are the raw pieces of information that drive journey analytics. They include behavioral data like clicks and scrolls, unique identifiers to track users across devices, and timestamps to detail when actions occur. Without these signals, it’s nearly impossible to create a complete picture, as fragmented sessions would replace cohesive user stories.
Adding emotional context – such as understanding user motivations and frustrations – can uncover friction points that behavioral data alone might miss.
With these elements in mind, let’s see how user journey analytics stacks up against traditional methods.
User Journey Analytics vs. Traditional Analytics
Traditional analytics often focus on isolated metrics, while user journey analytics connects the dots across multiple channels. For example, traditional web analytics looks at on-site behavior – like pageviews, session durations, or bounce rates – treating each visit as a standalone event. Product analytics, on the other hand, examines how users interact with specific features within a single platform. While useful, these approaches often operate in silos, making it tough to see how users transition between an email, a website visit, or a mobile app session.
User journey analytics, however, shifts the focus to individual users and their event sequences. This approach provides a cross-channel view, showing how various touchpoints combine to drive conversions – or where they fall short.
| Feature | Traditional Analytics | User Journey Analytics |
|---|---|---|
| Primary Focus | On-site behavior (pageviews, bounce rates) | Cross-channel interactions over time |
| Data Unit | Sessions and pageviews | Individual users and event sequences |
| Visibility | Limited to one channel (website or app) | Comprehensive view across email, SMS, web, app, and support |
| Goal | Traffic optimization | Enhancing lifetime value and customer experience |
This transition from session-based to event-based tracking allows businesses to clearly see how users progress through their journey and where improvements can be made.
sbb-itb-edfb666
3.2 Visualize Your User Journeys in Explore – Analytics Academy on Skillshop
How to Implement User Journey Analytics
5-Step User Journey Analytics Implementation Process
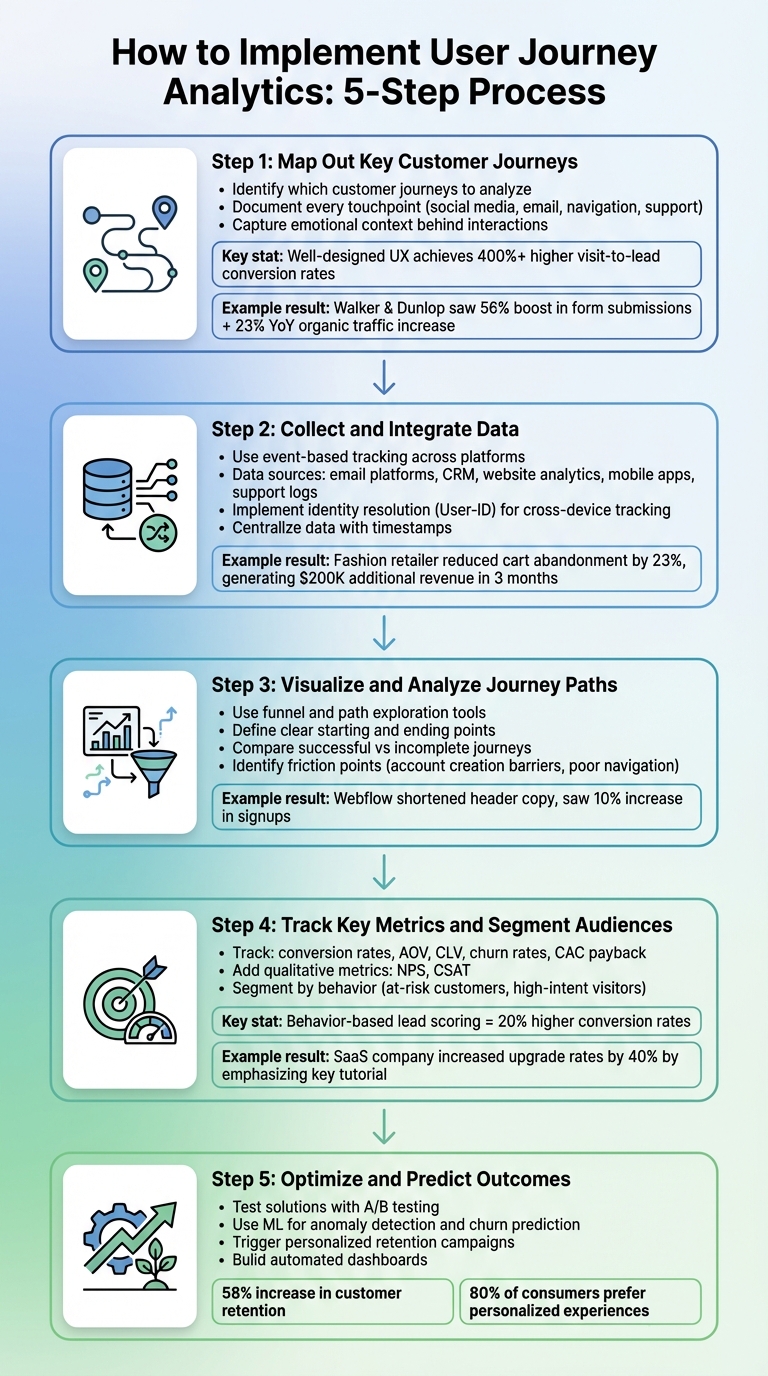
Setting up user journey analytics might seem daunting at first, but breaking it into manageable steps can simplify the process. Focus on mapping customer journeys, consolidating data, visualizing trends, tracking key metrics, and using insights to improve outcomes.
Step 1: Map Out Key Customer Journeys
Start by identifying which customer journeys you want to analyze. Are you focusing on a specific process, like signing up for an account, or the entire experience from a user’s first visit to their purchase? Tailor your approach to different user personas, considering how quick mobile interactions differ from in-depth desktop research. Document every touchpoint – social media ads, email clicks, navigation menus, or even customer support calls – and try to capture the emotional context behind these interactions. Why? Because understanding user sentiment can reveal areas for improvement.
Here’s a compelling example: Websites with well-designed user experiences often achieve visit-to-lead conversion rates over 400% higher than poorly designed sites.
In January 2026, Walker & Dunlop adopted Webflow’s analytics tools under Kokko Tso, their Vice President of Digital Marketing. This led to a 56% boost in form submissions and a 23% year-over-year increase in organic search traffic.
Step 2: Collect and Integrate Data
Once you’ve mapped the journeys, the next step is gathering data from all relevant channels. Use event-based tracking to monitor user actions across platforms. Your data sources might include email platforms, CRM systems, website analytics, mobile apps, and customer support logs. To make sense of it all, implement identity resolution methods (like "User-ID") to track users across devices. Server-side tracking can also enhance accuracy, as it bypasses privacy tools that block client-side pixels.
Centralize all this data into a single database, complete with timestamps for every action. Incorporate zero-party data (what users willingly share), first-party data (what you observe), and even second- or third-party data if it adds value.
In early 2026, a fashion retailer discovered that 40% of mobile users abandoned their carts at the shipping stage. By simplifying the mobile checkout process, they reduced cart abandonment by 23%, generating an additional $200,000 in revenue within three months.
Step 3: Visualize and Analyze Journey Paths
Use tools like funnel and path exploration to uncover where users drop off and track their event sequences. Define clear starting points (like the first website visit) and ending points (such as completing a purchase). By comparing successful journeys with incomplete ones, you can identify friction points. For instance, requiring users to create an account might deter them from completing a purchase, or a poorly designed navigation menu could leave them stuck.
During internal testing, the Webflow team found that lengthy header copy on their pricing page pushed key calls-to-action below the fold. After shortening the header, they saw a 10% increase in signups.
"When you’re going to different tools or people to ask for insights, that adds a lot of friction along the way. Especially after a launch… you need to see how people are using it and make actionable, data-driven decisions."
- Corey Moen, Manager of Web Design, Webflow
Clickmaps can highlight which elements users expect to be interactive, while scrollmaps reveal whether visitors are reaching your CTAs. If mid-page CTAs are being overlooked, consider moving them higher up the page.
Step 4: Track Key Metrics and Segment Audiences
After visualizing trends, focus on metrics that directly impact your business goals. Track conversion rates, average order values, customer lifetime value, churn rates, and CAC payback. Layer in qualitative metrics like Net Promoter Score (NPS) or customer satisfaction (CSAT) to understand the emotional experience at different journey stages.
Take segmentation beyond demographics by grouping users based on behavior. For example, identify "at-risk" customers who haven’t logged in recently or "high-intent" visitors who’ve reviewed your pricing multiple times. Companies that use behavior-based lead scoring often see 20% higher conversion rates by prioritizing users at the right stage of their journey.
A project management SaaS company in 2026 found that users who completed a specific tutorial within their first week were five times more likely to upgrade. By emphasizing this tutorial during onboarding, they increased their overall upgrade rates by 40%.
Step 5: Optimize and Predict Outcomes
Now that you have insights, it’s time to act. If you spot a bottleneck, test solutions like guest checkouts or simplified forms using A/B testing.
Modern tools equipped with machine learning can help you detect anomalies, like sudden drops in conversions, or predict which users are likely to churn or convert. This allows you to intervene early, perhaps by triggering a personalized retention campaign. Automated dashboards, built with tools like Looker Studio, can keep stakeholders informed about funnel performance and conversion timelines.
The benefits of these efforts are clear: 58% of organizations report noticeable increases in customer retention due to analytics, and 80% of consumers are more likely to buy from brands that offer personalized experiences based on journey data.
Tools and Technologies for User Journey Analytics
Popular User Journey Analytics Tools
When choosing a user journey analytics tool, it’s essential to think about your team’s technical expertise, budget, and overall goals. Google Analytics 4 (GA4) is a widely used option because it’s free and supports cross-device tracking using event-based data. Interestingly, 73% of businesses using GA4 focus on funnel analysis as their main use case. However, GA4 has a steep learning curve, especially when setting up more advanced tracking configurations.
For product-driven businesses, Amplitude is a standout choice. It specializes in cohort analysis and helps identify user behaviors that drive conversions. That said, its pricing starts at $999 per month, which might be a barrier for smaller teams. Similarly, Mixpanel offers deep user segmentation and customizable event tracking, with pricing also starting at $999 per month.
Heap takes a different approach with its "autocapture" feature, automatically tracking all user interactions without requiring manual tagging. This no-code solution is priced at $500+ per month but can result in cluttered data if not carefully managed.
For those focused on user experience, Contentsquare combines big-data analytics with visual tools like heatmaps and session replays, making it perfect for identifying frustration points like rage clicks.
"Contentsquare is such a critical piece for any marketeer’s analytics suite, because blending the qualitative and quantitative is really important." – Lisa Friedman, Former Associate Vice President of Web Marketing and Ecommerce at RingCentral
However, Contentsquare’s enterprise-level pricing is based on traffic volume, which might not suit smaller teams.
| Tool | Best For | Key Strength | Limitation |
|---|---|---|---|
| GA4 | General attribution | Free, cross-device tracking | Steep learning curve for complex setups |
| Amplitude | Product teams | Advanced cohort & retention analysis | High cost for smaller teams |
| Heap | Non-technical teams | No-code "autocapture" of all events | Can lead to data noise if not managed |
| Contentsquare | UX/UI designers | Visualizing user frustration (rage clicks) | Enterprise-level pricing |
| Fullstory | Troubleshooting | Detailed session replays | Primarily qualitative focus |
When evaluating these platforms, look for features like cross-channel tracking (covering mobile, web, email, and SMS), real-time monitoring to identify friction points, and privacy compliance functions like cookieless tracking or GDPR support. Many tools now also include AI-powered features like churn prediction and automated anomaly detection.
"Anybody can ask Sense a question, you don’t have to be an expert. And it’s so fast: it gets us the insights we need in seconds." – Francesca Ceron, Digital User Experience Lead at IDM Südtirol
While these tools are central to user journey analytics, there are additional technologies that can further enhance your insights.
Additional Technologies for Optimization
To get the most out of your analytics, consider pairing these platforms with complementary tools. For example, A/B testing tools like Optimizely or VWO can help you validate changes before rolling them out on a larger scale. Personalization engines can adapt content to match a user’s position in their journey, while survey platforms provide direct feedback using metrics like CSAT, NPS, and CES.
For businesses managing extensive datasets, exporting raw data from tools like GA4 or Contentsquare into BigQuery or other data warehouses allows for more advanced SQL-based analysis. From there, you can integrate with BI tools like Tableau or Power BI for deeper visualizations. Marketing automation platforms, such as HubSpot, Marketo, or Salesforce, can also trigger real-time campaigns, like sending a personalized email when a user abandons their cart.
Interestingly, about 42% of enterprises use multiple analytics tools together, often combining GA4 for attribution with specialized platforms for session replays or product insights. This multi-tool approach helps unify data across departments, breaking down silos and creating a more cohesive view of the customer experience.
Business Benefits of User Journey Analytics
User journey analytics isn’t just about tracking data – it’s about leveraging that data to create meaningful improvements across your business.
Better Customer Retention and Satisfaction
Understanding where users encounter friction is key to keeping them engaged. User journey analytics pinpoints these pain points, such as abandoned carts during checkout or difficulties rescheduling appointments. Instead of guessing the reasons behind customer drop-offs, companies can address the exact issues causing frustration. A striking example: 58% of organizations have reported noticeable increases in customer retention thanks to customer analytics.
Another game-changer? Predictive churn management. By analyzing patterns in user behavior, businesses can identify customers at risk of leaving and take proactive steps to re-engage them. For SaaS companies, this might mean enhancing onboarding experiences to help users quickly grasp the value of the product. Interestingly, 63% of interactive demos are deployed during onboarding to highlight this value early on.
Journey analytics also fosters collaboration across teams. By providing a shared view of the customer experience, sales, marketing, and support teams can align their efforts, ensuring customers receive consistent, high-quality interactions. Real-time monitoring adds another layer, enabling businesses to adjust quickly if a conversion path falters or a messaging sequence underdelivers.
These efforts not only improve retention but also streamline operations, reducing costs in the process.
Cost Reduction Through Data-Driven Decisions
Data-driven insights help businesses cut costs by eliminating inefficiencies. For instance, identifying bottlenecks in processes – like a confusing repair scheduling system – can reduce the need for additional customer service calls or rescheduled appointments, which consume valuable resources.
Companies with advanced analytics programs see a significant financial advantage, achieving 5–8x higher ROI on marketing spend compared to those relying on guesswork. By using real data to optimize traffic and improve conversion rates, businesses can lower customer acquisition costs (CAC) while delivering better results.
These savings free up resources that can be reinvested in scalable, personalized experiences for customers.
Personalized Customer Experiences at Scale
User journey analytics doesn’t just track what customers are doing – it helps businesses understand why they’re doing it. By analyzing interaction sequences, companies can contextualize user behavior across touchpoints and adjust messaging or content in real time based on live data streams.
Predictive modeling takes personalization to the next level. Machine learning can score users based on factors like purchase likelihood or churn risk, enabling companies to target specific segments with tailored content. Instead of relying on static demographic data, businesses can group audiences based on real-time behaviors, delivering content that’s relevant to each user’s journey at precisely the right moment.
This combination of real-time insights and predictive analytics allows businesses to scale personalization without sacrificing quality.
Advanced Optimization Strategies
Fine-tune your user journey analytics to improve transitions, reveal hidden patterns, and drive measurable growth.
Channel Orchestration for Smooth Transitions
Today’s customers seamlessly switch between devices – mobile, desktop, email, and apps. Channel orchestration helps tie all this data together into a single, unified view. By linking engagement metrics, product usage, and user attributes, it eliminates data silos and provides a clearer picture of user behavior.
A key component of this process is identity resolution. Tools that rely on User-ID tracking can follow authenticated users across devices, ensuring their actions are seen as part of a single journey. For example, a user might explore pricing on their phone but later complete the purchase on their desktop. Without proper tracking, these actions might appear as if they were performed by two different individuals.
Real-time orchestration takes it a step further. Platforms like Canvas allow you to create automated cross-channel journeys that adapt in real time based on user behavior. For instance, messaging can instantly adjust to reflect the latest actions a user has taken, keeping them engaged and improving their overall experience.
Cohort Analysis for User-Centric Insights
Cohort analysis groups users based on shared behaviors or characteristics, such as "power users" or "churned users." This approach uncovers patterns that traditional metrics often miss. Unlike static personas, cohorts are built using real-time signals from actual user interactions.
One of the most powerful applications of cohort analysis is identifying "happy paths" – the specific sequences of actions taken by successful users. For example, a project management SaaS company found that users who completed a certain tutorial during their first week were five times more likely to upgrade. By prioritizing this tutorial in their onboarding flow and connecting product usage data to subscription revenue, they boosted their upgrade rates by 40%.
Cohort analysis also shines when it comes to spotting drop-off points. Comparing the journeys of churned users to those of power users can highlight areas of friction – like a confusing customization step that discourages new signups. Armed with this insight, you can implement targeted interventions, such as in-app prompts, to help users reach their "aha moment" sooner. By layering operational metrics on top of these insights, you can align user behavior with business outcomes even more effectively.
Integrating Operational Metrics for Growth
Operational metrics like revenue, customer lifetime value (CLV), and cost to serve are essential for breaking down data silos and gaining a deeper understanding of customer interactions. For instance, a decline in feature usage might seem problematic at first glance. But when paired with support logs and CRM data, it could reveal that these users are transitioning into high-value customers through direct team engagement.
In March 2022, a printer hardware company used this approach to tackle a customer satisfaction issue in their repair process. By overlaying Net Promoter Scores (NPS) and cost-to-serve data onto the customer journey, they found that missed repair appointments led to higher costs and lower satisfaction. To address this, they introduced a mobile self-service booking system with push notifications, reducing missed repairs and easing the workload on their customer care team.
"Customer journey analytics can help you to nail down exactly why your customers behave the way they do and tie your customer experience efforts to financial outcomes."
– Adam Bunker, Author, Qualtrics
Tracking metrics like the customer acquisition cost (CAC) payback period can also provide valuable insights. For instance, understanding how long it takes for a specific cohort’s lifetime value to cover acquisition costs is key to assessing profitability. Businesses that integrate journey data with sales metrics for behavior-based lead scoring often see 20% higher conversion rates. This approach ensures that you’re not just monitoring user behavior but actively connecting it to growth and profitability.
Conclusion
User journey analytics is transforming the way businesses interact with their customers. Instead of relying on hunches, companies now have the ability to make decisions grounded in data. As ContentMation aptly states: "In 2026, guessing is no longer a strategy. Customer Journey Analytics… gives you the clarity to make decisions that directly impact revenue".
The numbers speak for themselves: companies with advanced analytics programs see 5–8x higher ROI, 58% better customer retention, and as much as 200% more visit-to-order conversions. These results highlight the power of leveraging data to guide decisions.
But user journey analytics isn’t just about numbers. It helps break down internal barriers that often hinder progress. When marketing, sales, and support teams operate with a shared understanding of customer behavior, they can align their efforts, address issues proactively, and prevent churn. This proactive approach is what sets thriving companies apart from those stuck in place.
To make the most of user journey analytics, start by building a solid foundation. That means investing in reliable tracking systems, simplifying data pipelines, and fostering a mindset of experimentation. Document your ideas, test them systematically, and pair quantitative data with qualitative insights. This approach helps uncover not just what customers are doing, but also why they’re doing it – crucial for meaningful improvements.
Once you have this framework in place, focus on solving one major challenge first. Whether it’s reducing cart abandonment, refining onboarding processes, or scaling personalized experiences, user journey analytics equips you to track what’s important and act on insights in real time.
FAQs
What events should I track first?
Tracking core interactions is essential to understanding the user journey. Begin by focusing on actions like website visits, app launches, account creation, or adding items to a cart. These early events reveal how users enter your funnel and highlight where they might drop off.
Beyond that, keep an eye on key engagement milestones such as purchases, subscriptions, or feature usage. These data points can uncover friction areas, providing opportunities to refine the experience and improve both retention and conversions.
How do I connect users across devices?
To bring users together across their various devices, cross-device tracking is key. This technique combines user data from multiple sources – smartphones, tablets, desktops, and even connected TVs – into a unified profile. It works by linking interactions through shared identifiers like login details or using more advanced approaches, such as deterministic and probabilistic matching. The result? A comprehensive understanding of the customer journey, which helps create smooth and consistent experiences no matter which device they’re using.
How do I prove ROI from journey analytics?
To show the return on investment (ROI) from journey analytics, tie your insights directly to measurable business results. Focus on metrics that matter, such as revenue growth, customer retention, referral rates, and marketing efficiency.
The key is to demonstrate how journey analytics lead to meaningful improvements – like reducing churn, boosting customer lifetime value, or increasing conversion rates. Use data-driven attribution to make a clear connection between these outcomes and financial gains, such as higher revenue or cost savings. By doing this, you can directly link your analytics efforts to real business impact.